
Alberta Nonprofit Data Strategy
Data About the Sector
Analytics for non-profits to strategize for the future!
Quick Access Menu
New: Championing the Power of Data in Challenging Times
This 2023-2024 Annual Report highlights the non-profit sector’s impact, current challenges, priorities over the past year by combining Alberta Nonprofit Data Strategy’s previous work with other recent analyses on the sector. It also provides resources that can help non-profits in the future.
Focusing on four key areas, the report highlights:
- Alberta’s social profit, which emphasizes measuring success by looking at the positive effects non-profits have on society instead of just focusing on financial metrics.
- The maze of challenges Albertans and the non-profits serving them face due to the recent difficulties around the cost of living.
- How strengthening the non-profit sector can occur by enacting priorities that will overcome the maze of challenges.
- The data-oriented initiatives PolicyWise for Children & Families leads that support non-profits on their data journeys.

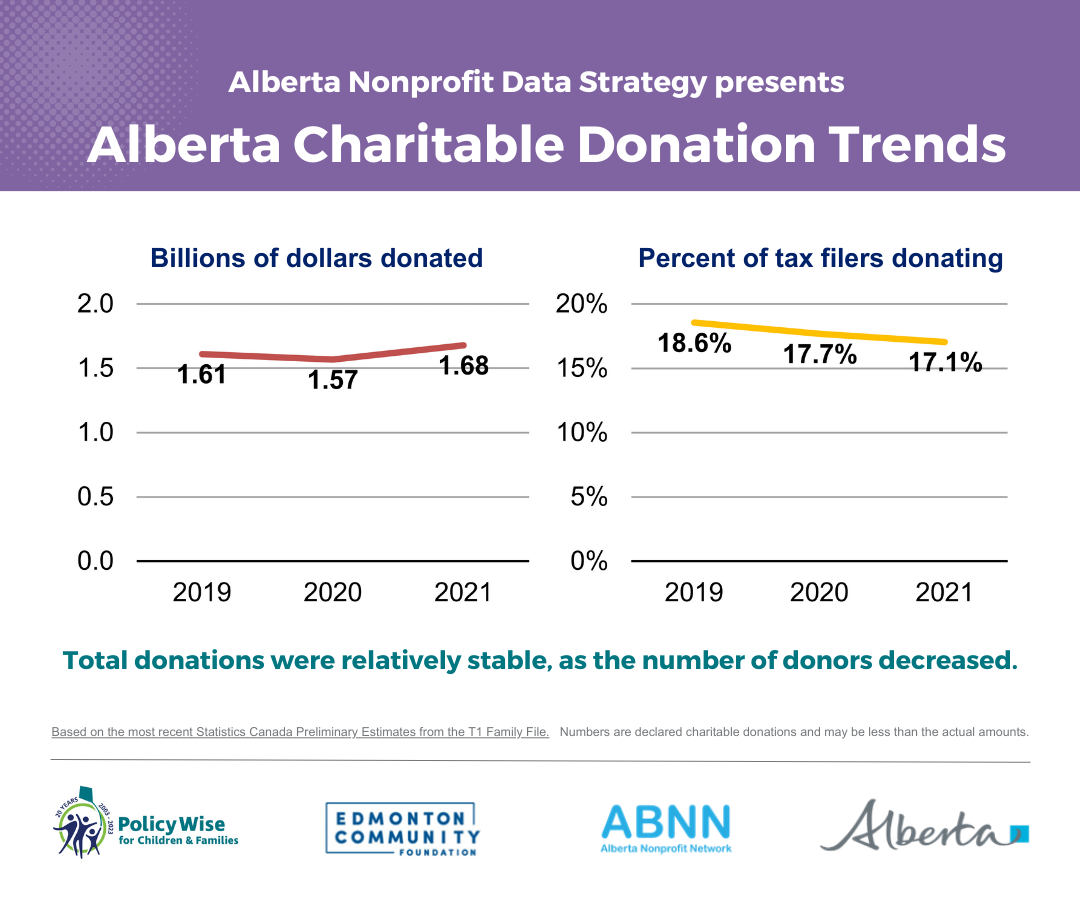
Alberta Charitable Donations 2019-2021
This analysis is on charitable donations in Alberta (Statistics Canada).
Donations over time. Donations were relatively stable from 2019 to 2021. This is despite the number of donors falling over time.
Who donated? Albertans that donated tended to be older and have more income.
Where were donors? Lethbridge, Calgary, and Edmonton donations were above Alberta averages, with Red Deer and Medicine donations leading as well.
Community Non-Profit Analysis, Second Quarter 2023 – Alberta Non-Profits’ Optimism Soars as Economy Heats Up
This analysis is on community non-profits surveyed by Statistics Canada in Alberta in the second quarter of 2023 and Alberta economic data.
The Alberta economy remains hot. Unemployment remained relatively low, dropping slightly from 6% in January to 5.9% in April (seasonally adjusted). In addition, Alberta inflation reversed in April from its download trend (Alberta 2023: January 5%, March 3.3%, April 4.3%). Similar increases across Canada led the Bank of Canada to attempt to further put brakes on an overheated economy by increasing interest rates to a peak of 4.75% this June.
This quarter revealed many positive trends for the Alberta community non-profit sector. Non-profits were increasingly optimistic about the next year (last two quarters; from 77% to 94% being optimistic). Many reported improved obstacles by non-profits from the last quarter with less organizations being concerned with rising inflation (from 65% to 47%) and rising cost of inputs (from 41% to 23%). Other improvements over the last quarters were decreased expectations of rising expenses (from 56% to 31%) and challenges with recruiting employees (last three quarters; 43% to 32% to 17%). This last improvement contrasts Canadian trends, where 44% of non-profits are still reporting challenges recruiting employees.
The Alberta community non-profit sector showed expectations in line with their current optimism. However, with a hot economy and increasing inflation, further interest rate hikes may be in store to attempt to slow an overheated economy. Despite recent positive sentiments, a recession is still not out of the picture and nonprofits will be on the frontline playing a critical role if it does by supporting our communities.

PolicyWise for Children & Families: Canadian Non-Profit Dashboard (with Updated Volunteering Data)
PolicyWise created this dashboard to show the impact of the non-profit sector across Canada. It uses data from Statistics Canada.
Check this box to see how to use this dashboardCustomize the information displayed using the toolbars. First, select from the five options:
- Sector Snapshot displays a summary of overall findings about the sector.
- Sector Over Time displays economic and workforce data from the previous five years.
- Nonprofit Types displays a comparison of impacts for three types of nonprofits, including their source of funding.
- Nonprofit Subsectors displays economic, workforce, and volunteer impacts across different subsectors like social services and health.
- Rural/Urban Nonprofits displays how impacts are distributed in rural and urban settings.
Choose the geography, type of non-profit, and year that you are interested in. Hover over the ‘?’ that appears beside each of the dashboard concepts to learn more. Use the +/- bar and the ‘Open in a new window’ buttons at the bottom to modify size.
- Statistics Canada. Table 36-10-0613-01. Production, income and outlay accounts of non-profit institutions (x 1,000,000). DOI: https://doi.org/10.25318/3610061301-eng
- Statistics Canada. Table 36-10-0617-01. Employment in non-profit institutions by sub-sector (x 1,000). DOI: https://doi.org/10.25318/3610061701-eng
- Statistics Canada. Table 36-10-0618-01. Economic value of volunteering activity (x 1,000,000). DOI: https://doi.org/10.25318/3610061801-eng
- Statistics Canada. Table 36-10-0614-01. Gross domestic product (GDP) and income of non-profit institutions by activity (x 1,000,000). DOI: https://doi.org/10.25318/3610061401-eng
- Statistics Canada. 2022. Rural Canada Non-Profits database, 2019. https://www150.statcan.gc.ca/n1/pub/45-20-0004/452000042022002-eng.htm
- Statistics Canada. 2021. General Social Survey – Giving, Volunteering and Participating (GSS GVP) – Public Use Microdata Files.
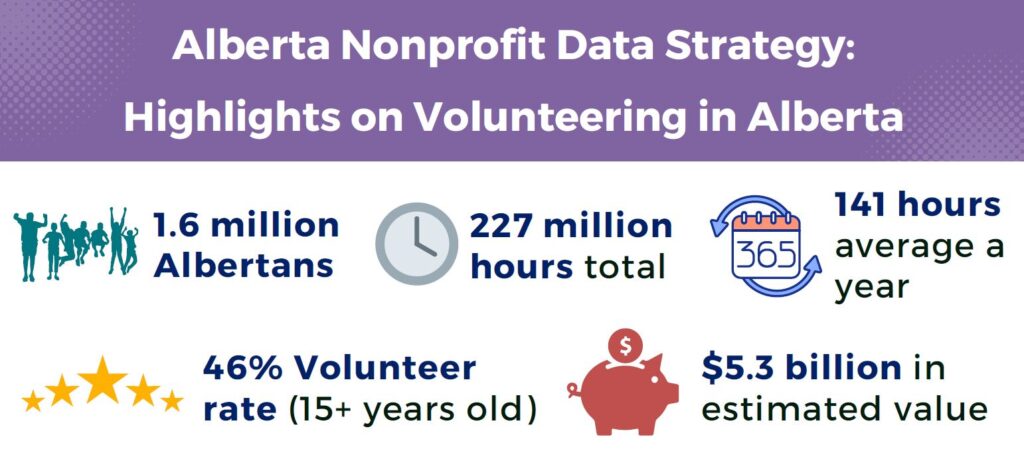
Highlights on Volunteering in Alberta
We conducted this analysis using Alberta results from the General Social Survey: Giving, Volunteering and Participating survey from Statistics Canada. We explored cross-volunteering numbers and various details on volunteering, such as volunteering subsectors, how people volunteered, and various information about motivation for and experiences in volunteering.
- Download the Highlights on Volunteering in Alberta.

Community Non-Profit Analysis, Fourth Quarter 2022 – Workforce Needs Amidst Rising Costs
We conducted this analysis based on responses by community non-profits surveyed by Statistics Canada in Alberta. We explored community non-profits’ outlook and their employee situation. We focused on volunteer and employee struggles in the sector.
- Download the Community Non-Profits Q4 2022 Analysis 1-page summary.
Community Non-Profit Analysis, Third Quarter 2022 – Deflating Ballooning Community Challenges
We conducted this analysis based on responses from community non-profits surveyed by Statistics Canada across Canada. We focused on signs of growing stability in the community non-profit sector, ongoing cost and employee struggles, and plans for the future.

Community Non-Profit Analysis, Second Quarter 2022 – Rising Demands on Employees
We conducted this analysis based on responses by community non-profits surveyed by Statistics Canada across Canada. We explored community non-profits’ outlook and their employee situation. We focused on employee struggles in the community non-profit sector and plans for employee recruitment and retention.
- Download the Community Non-Profits Q2 2022 Analysis 1-page summary.
- Download Figures and Notes related to the analysis.
Community Non-Profit Analysis, First Quarter 2022
We conducted this analysis based on responses by community non-profits surveyed by Statistics Canada across Canada. We explored community non-profits’ outlook, employee outlook, and planned work arrangements. In this analysis we discuss the current state of community non-profits compared to previous quarter. We tell a story on the impact of COVID-19 on the non-profit sector over time and how the non-profit sector experience differs from the private sector.
- Download an Infographic for snapshot of the Q2 findings.
- Download the Full Analysis with Analytic Notes.
Community Non-Profit Analysis, Fourth Quarter 2021
We conducted this analysis based on responses by community non-profits surveyed by Statistics Canada across Canada. We explored community non-profits’ outlook, employee outlook, and measures planned for the COVID-19 pandemic. In this analysis we discuss the current state of community non-profits compared to previous quarter. We tell a story on the impact of COVID-19 on the non-profit sector over time and how the non-profit sector experience differs from the private sector.
- Download the Infographic for a snapshot of the Q4 findings.
- Download the Full Analysis with Analytic Notes.
Community Non-Profit Analysis, Third Quarter 2021
We conducted this analysis based on responses by community non-profits surveyed by Statistics Canada across Canada in July – August of 2021. We explored community non-profits’ outlook, employee outlook, and past and planned measures for COVID-19. In this analysis we discuss the current state of community non-profits compared to the previous quarter.
- Download the Infographic for a snapshot of the Q3 findings.
- Download the Full Analysis with Analytic Notes.
Community No-Profit Analysis, Second Quarter 2021
We conducted this analysis based on responses by community non-profits surveyed by Statistics Canada across Canada in April – May of 2021. We explored community non-profits’ outlook, employee outlook, and past and planned measures for COVID-19. In this analysis we discuss the current state and future directions of community non-profits during the COVID-19 pandemic.
- Download the Infographic for a snapshot of the Q2 findings.
- Download the Full Analysis with Analytic Notes.
- Watch the webinar.
The Registered Charity Analysis (2015-2018) with notes!
We conducted the Registered Charities Analysis 2015-2018 to provide information on the economic and workforce impact of community nonprofit registered charities in Alberta. It describes the economicand workforce impact cross-Alberta, in different subsectors (e.g., social services, and culture and recreation), and in different Alberta regions.
- Download the Use and Technical Manual for more details and information on how to use the files
- Download a high resolution version of the analysis without notes
