Demographic Datapedia Entry:
Education
Each Datapedia entry begins with definition(s) of the demographic variable followed by some considerations and limitations of the variable for understanding populations of people.
Next, a suggested question(s) and response options are shown. Note that this is given as guidance rather than a prescription of what’s best as that will depend on the information needs and context of your organization. Also included are ideas and examples of how to ask questions about the demographic variable in conversation.

Plan
It’s important to invest time in seeking out your “Why?” with data to ensure the data collected support your information needs. For more on this, see the Plan section of the Data Lifecycle.
Finally, a diagram is shown to illustrate basic, detailed, and comprehensive response options for the variable.
- The basic options are the minimum set of response options that are suggested for each variable.
- The detailed and comprehensive categories illustrate more detailed and nuanced response options that may be important to consider depending on your information needs and organization’s context.
- The diagram of response options show how each category can be collapsed into the basic set of answers. For example, the detailed and comprehensive response options can be collapsed or aggregated into the basic response options for analysis.
- Consider all response options when deciding on which category best suits your organization’s needs.
Importantly, the suggestions and details of the response options will need to be revisited and revised periodically to reflect shifts and changes that may emerge in various variables over time.1

BUILD
For ideas on how to collect and record quality data see the Build section of the Data Lifecycle.
2.1 Definition
A. Refers to the highest level of education completed or attained.2
B. Education categories include for example, ‘no formal education or training, grades K-12, post-secondary, and other designations’.
2.2 Considerations and Limitations
Education can be used to understand:
- A person’s ability to attain a job or occupation and their potential income.3
- A person’s education that is in progress.
- A person’s set of skills that they acquired within their education.4
Education cannot be used to understand:
- Soft skills that are not highlighted in their credentials.5
- A person’s future career prospects or goals.6
- A person’s ability to work efficiently in the labour force, as the highest completed education level may not accurately reflect what they can do.7
- Other achievements or completed training.8
2.3 Suggested Collection Methods
The minimum suggested data collection method, or “basic” option below reflects a synthesis of practices, considerations from nonprofit stakeholders, and recognized standards in capturing demographic data. The “basic” question is modeled after what might be asked on an intake form during an initial meeting with a client. The process by which intake or registration occurs can vary widely depending on the context within which you are working. For example, the way questions are asked and data are recorded will vary for clients in crises, as compared to walk-in or drop-in sessions, or when registering for a program that requires people to meet certain eligibility requirements. In those cases, the suggested collection method can be used as a starting point but adapted to fit the needs of the context within which the data are being collected.
As a standard practice we suggest always including an option for people to write in an answer that may not fit within the options provided, along with an option not to answer. These are both important for creating inclusive demographic questions.1, 9, 10
2.3.1 Basic Question(s)
What is the highest level of education you have completed?
- No formal education or training
- Primary school (K-9)
- High school (10-12)
- Post Secondary
- Another level of education not listed, please specify: ________
- Prefer not to answer
In conversation, the question may be phrased as:
- Tell me about your schooling.
- What is your educational background?
- Where did you last attend school?
2.3.2 Diagram of Response Options
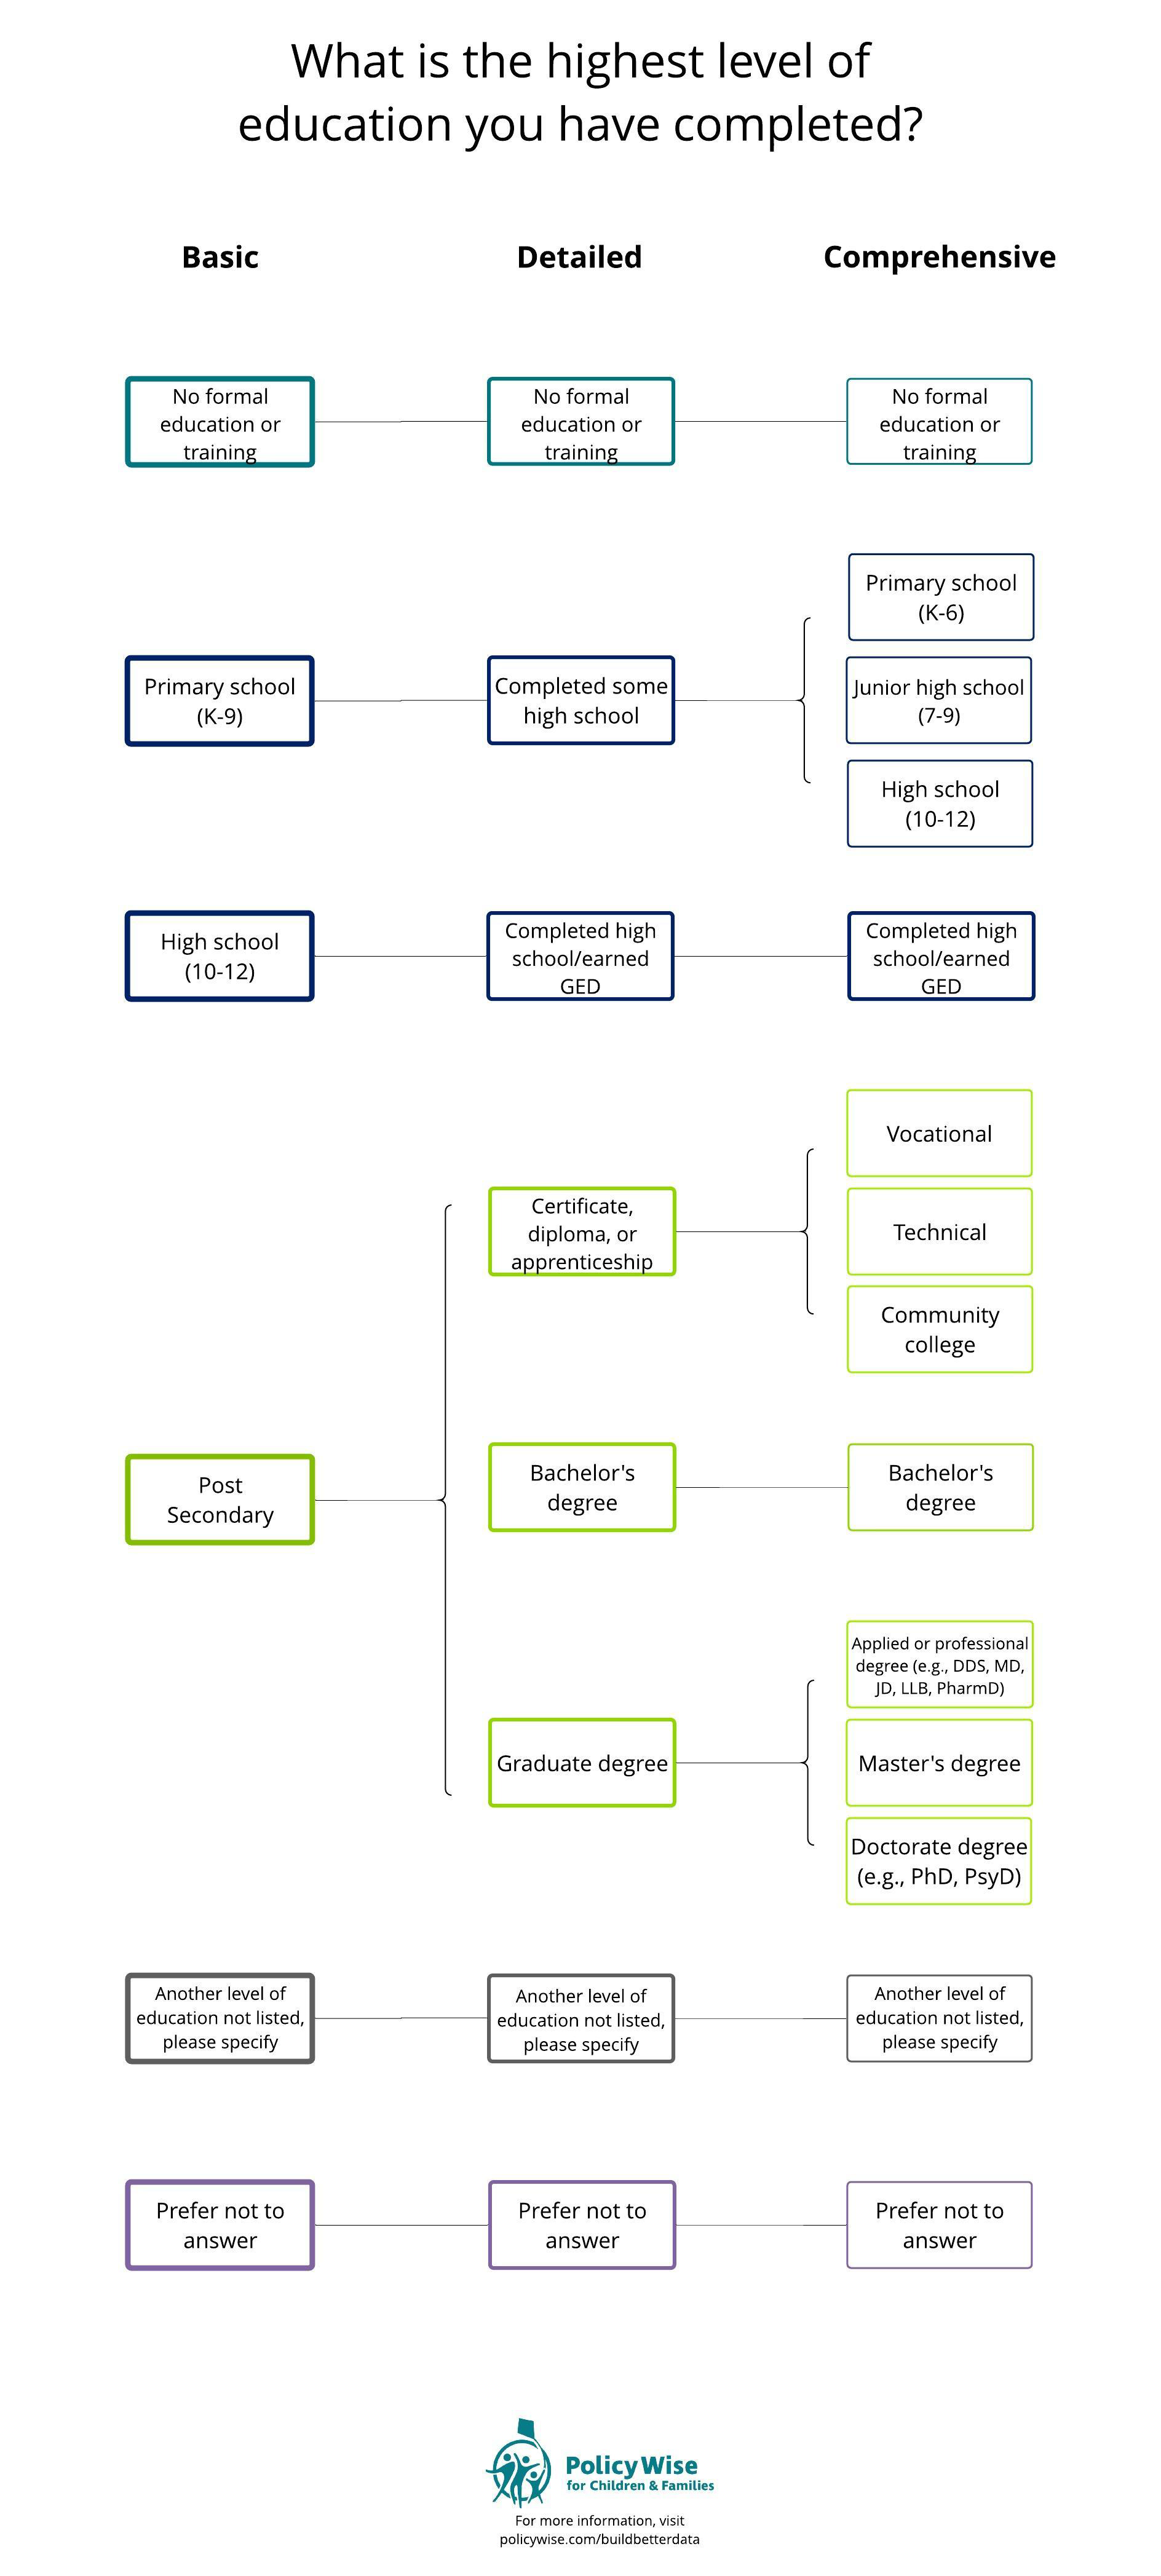
What is the highest level of education you have completed?
The diagram shows an overview of the basic, detailed and comprehensive response options. The options are not necessarily exhaustive, but they are modeled after what organizations may want to provide depending on the needs and context of their work. The question can be found at the top of the diagram and the response choices are mapped into the basic, detailed, and comprehensive levels. Not all variables warrant all levels of response options.

COLLECT
For considerations on building trust and relationships through data collection see the Collect section of the Data Lifecycle.


LENSES
You may wish to approach your data collection work through the lens of a particular framework or set of guiding principles, which will shape how you think about your response options. For more details, see the Lenses section of the Data Lifecycle.
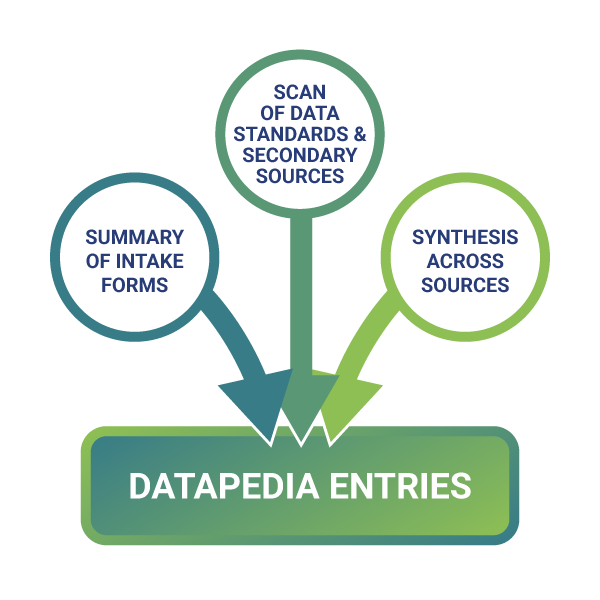
To create the diagram for variable responses, two main sets of sources were used.
- Organization intake and registration forms from nonprofit subsectors across Alberta.
- Best practices in data collection, academic literature of demographic data, and resources from data aggregators (e.g., Statistics Canada, National Institutes of Health).
Findings from these sources were synthesized and organized across three levels of response options: basic, detailed, and comprehensive. To learn more please see the full methods. Datapedia Project Approach and Acknowledgements.pdf
Footnotes
-
Frederick, J. K. (2020, November 18). Four strategies for crafting inclusive and effective demographic questions. Ithaka S+R Blog. https://sr.ithaka.org/blog/four-strategies-for-crafting-inclusive-and-effective-demographic-questions/
-
Statistics Canada. (2020, February 24). Educational attainment of person. www23.statcan.gc.ca/imdb/p3Var.pl?Function=DEC&Id=85134.
-
Statistics Canada. (2012). Educational attainment and employment: Canada in an international context. (No. 81-599-X). https://www150.statcan.gc.ca/n1/en/pub/81-599-x/81-599-x2012008-eng.pdf?st=km09_Egk
-
Council of Ministers of Education, Canada. (2016). Postsecondary education and skills in Canada: Findings from the Programme for International Assessment of Adult Competencies (PIAAC). https://www.cmec.ca/Publications/Lists/Publications/Attachments/362/PIAAC_PSE_CMEC_2016_EN.pdf
-
Houses of Parliament. (2018). Developing non-academic skills. POSTnote. https://www.educ.cam.ac.uk/people/staff/demetriou/all_publications/POST-PN-0583.pdf
-
Organisation for Economic Cooperation Development. (2012). How does education affect employment rates? Education at a Glance 2012: Highlights. https://doi.org/10.1787/eag_highlights-2012-11-en
-
Chamorro-Premuzic, T. & Frankiewicz, B. (2019, January 14). Does higher education still prepare people for jobs? Harvard Business Review. hbr.org/2019/01/does-higher-education-still-prepare-people-for-jobs
-
Statistics Canada. (2018, February 14). Education indicators in Canada: An international perspective 2017: Chapter E participation in formal and/or non-formal education. www150.statcan.gc.ca/n1/pub/81-604-x/2017001/ch/che-eng.htm.
-
Fernandez, T., Godwin, A., Doyle, J., Verdin, D., Boone, H., Kirn, A., Benson, L., & Potvin, G., (2016). More comprehensive and inclusive approaches to demographic data collection. School of Engineering Education Graduate Student Series, 60. http://docs.lib.purdue.edu/enegs/60
-
Lesbian, Gay, Bisexual, & Transgender Equity Center. (n. d.). Good practices: Demographic data collection. University of Maryland. https://lgbt.umd.edu/good-practices-demographic-data-collection
Do you have additions to suggest to the Datapedia? Or, do you want to learn more about working with data?
We’d love to hear from you. Contact us at info@policywise.com.


